


Tracking performance is key to improving any marketing effort. Whether you’re running a one-time promotion or managing multiple campaigns across different platforms, understanding what’s working (and what’s not) helps you make better decisions.
This guide walks you through how to measure campaign performance in Replug, step by step, so you can gain clear insights, optimize your strategy, and get more out of every click.
Link Management Made Easy
Your go to link management tool for CTAs, branded and bio links, QR Codes, tracking and retargeting.
Get Started for FREE!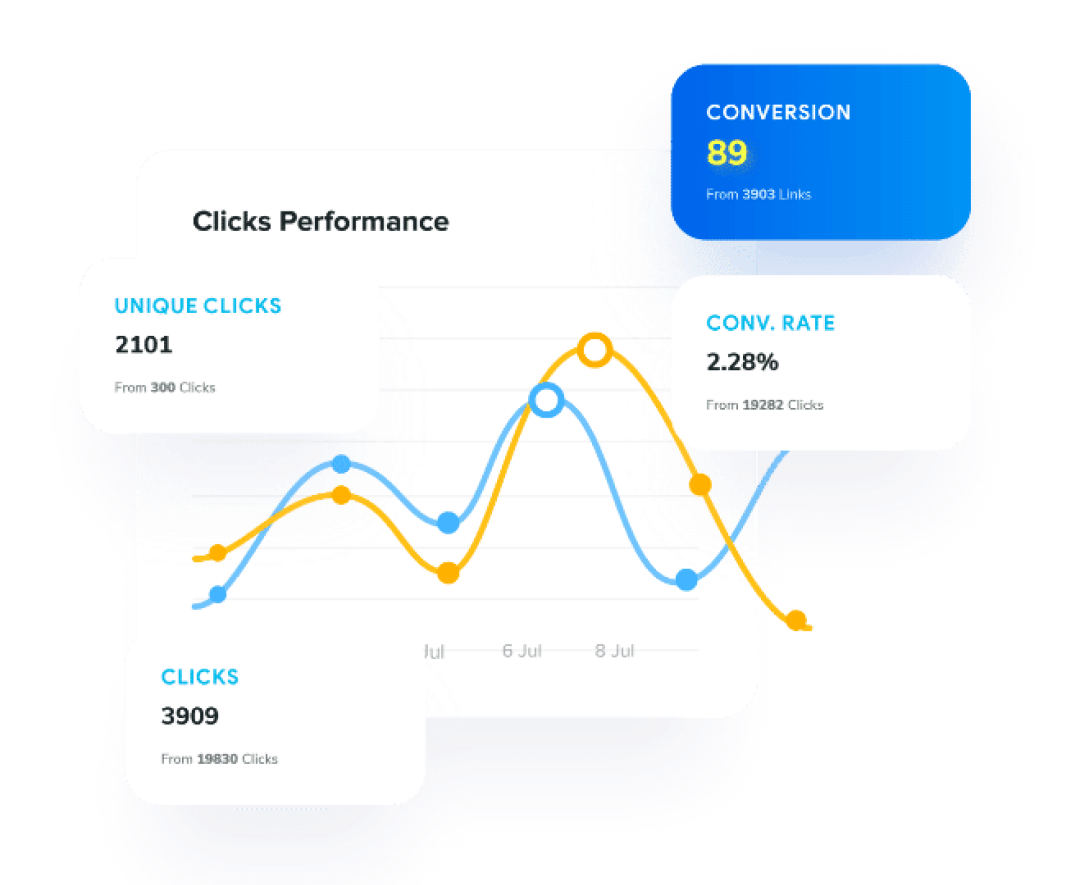
What is campaign analytics?
Campaign analytics is the process of tracking and analyzing data from marketing campaigns to measure performance and refine strategies. It helps marketers understand which channels drive conversions, how users interact with content, and where to focus efforts for maximum impact.
In link management, campaign analytics is essential. It tracks clicks, conversions, and audience behavior for each link, helping you optimize performance and improve ROI. To get started with campaign analytics in Replug, follow these simple steps:
How to measure campaign performance in Replug?
Step 1: Log in to your Replug account
Go to Replug and sign in with your credentials. If you don’t have an account, you’ll get a free 14-day trial upon signing up.
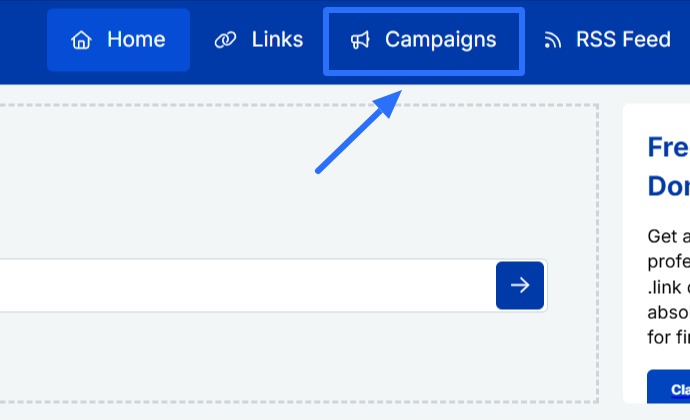
Step 2: Click on “Campaigns”
Once logged in, click on “Campaigns” from the navigation to view all your active and archived campaigns.
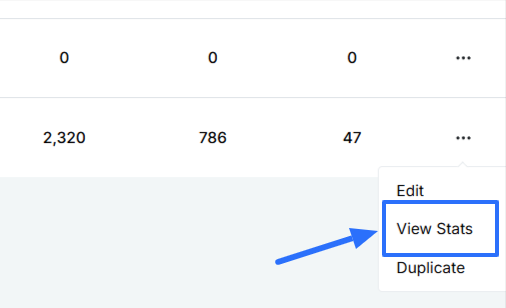
Step 3: Click on “View stats”
Find the campaign you want to analyze and click the “View stats” button.
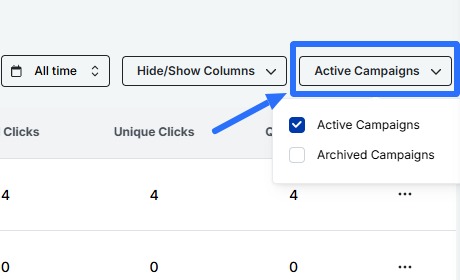
Optional: You can filter campaigns by:
- Date range (e.g., last 7 days, last 30 days, custom range)
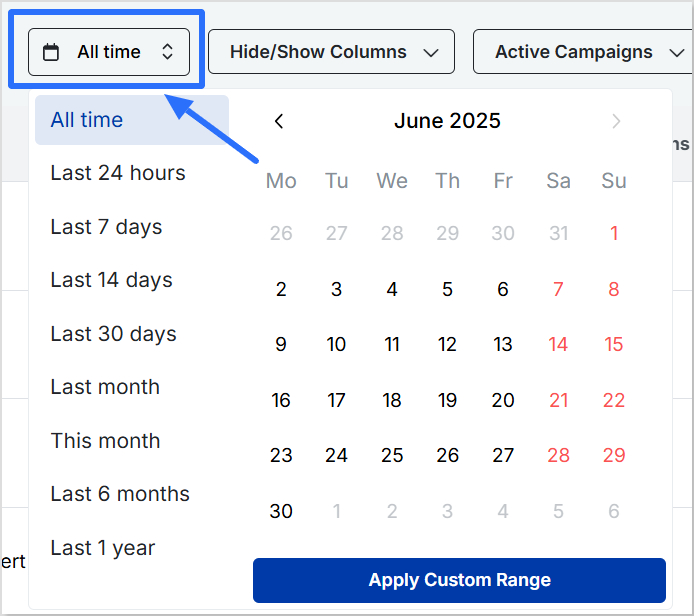
- Hide/Show columns (CTA type, campaign type, headline, total links, total clicks, unique clicks, QR scans)
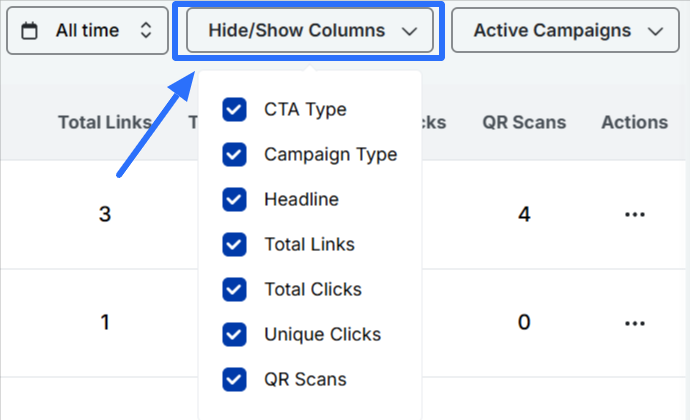
- Campaign status (active, archived)
Step 4: Track campaign performance
Inside the stats dashboard, Replug gives you a complete view of your campaign’s activity:
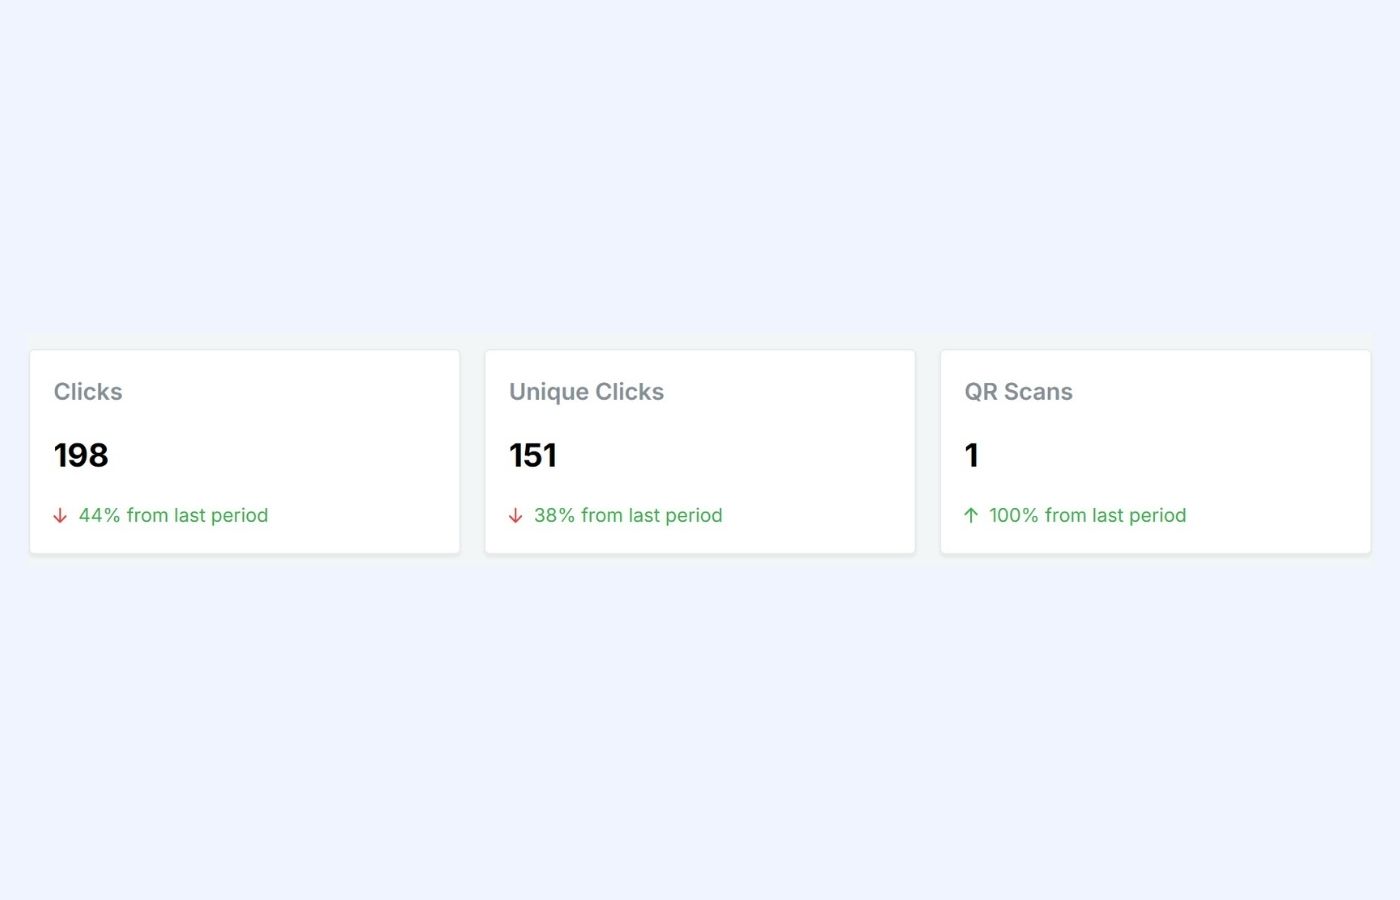
- Key metrics
- Total clicks: Overall number of clicks on your links
- Unique clicks: Individual users who clicked
- QR scans: Total number of QR code scans
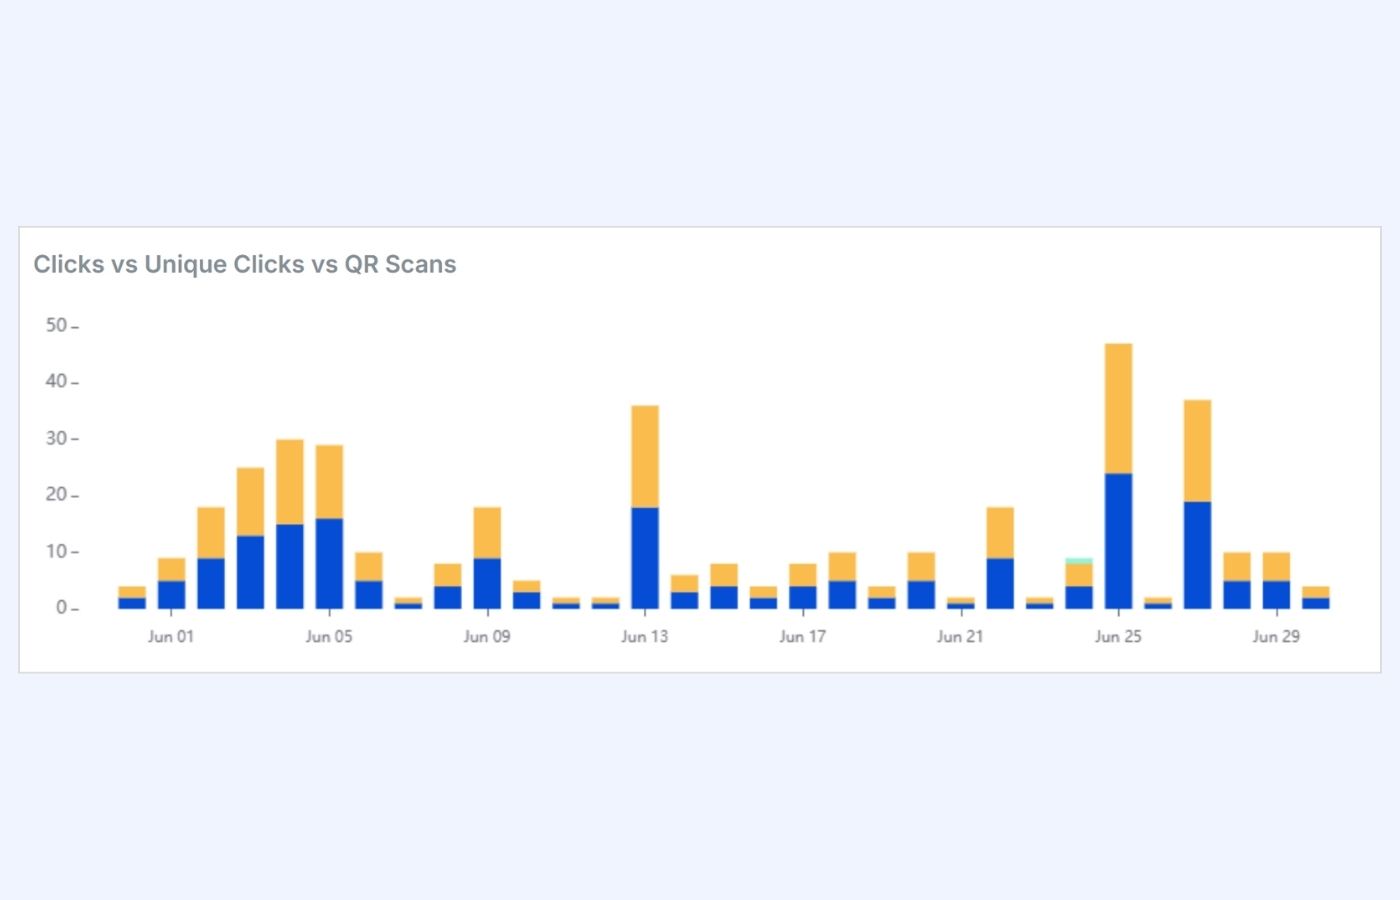
- Visual graph
Compare activity trends over time. You can spot peaks, analyze dips, and assess overall campaign momentum.
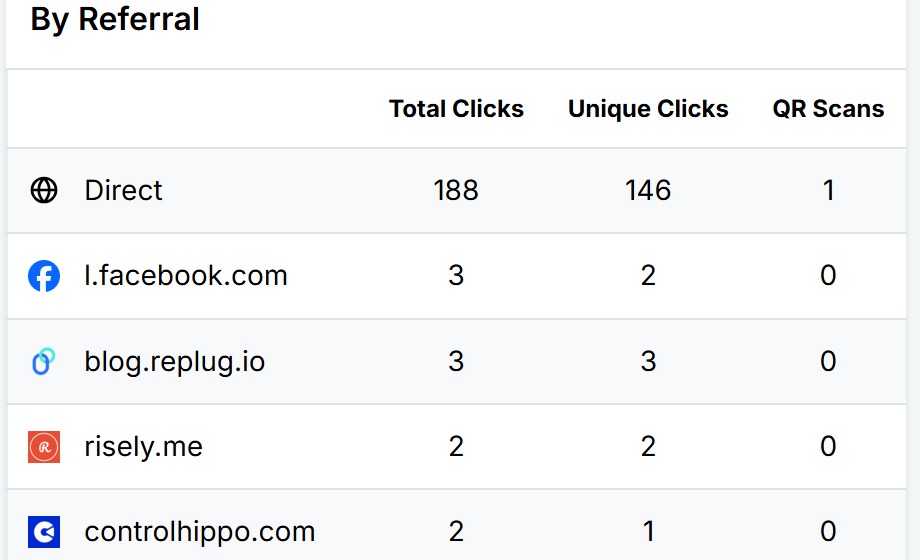
- Detailed breakdown
- By referral source: See which platforms or websites are sending you traffic
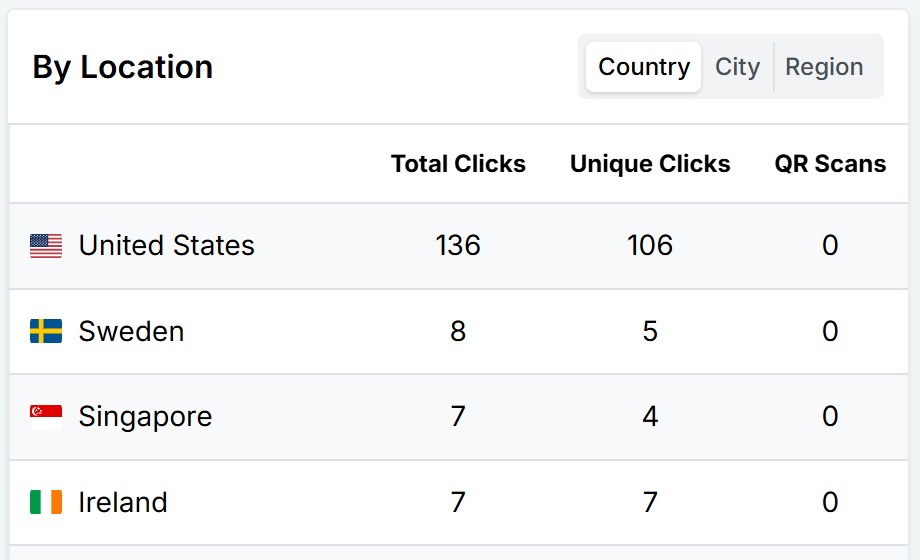
- By location: Identify which countries or cities are engaging the most
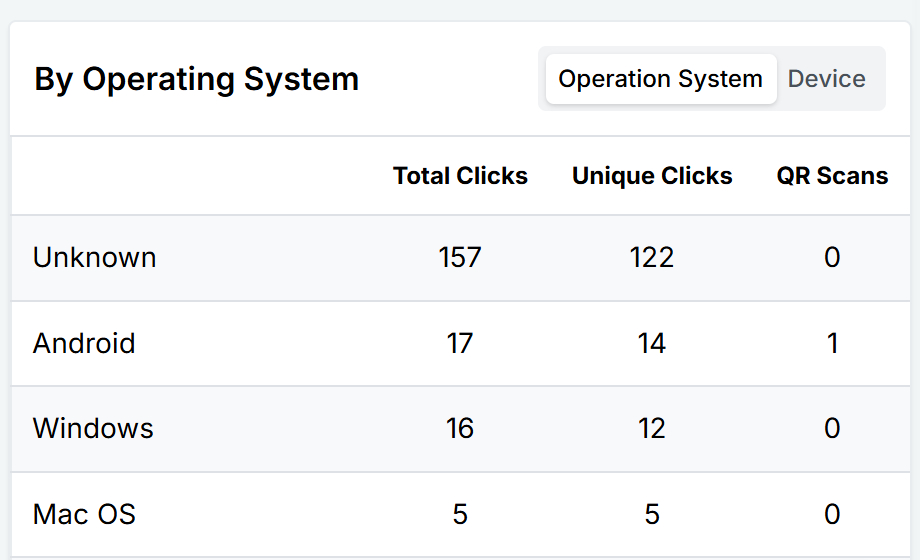
- By operating system: Understand what devices people are using (e.g., iOS, Android, Windows)
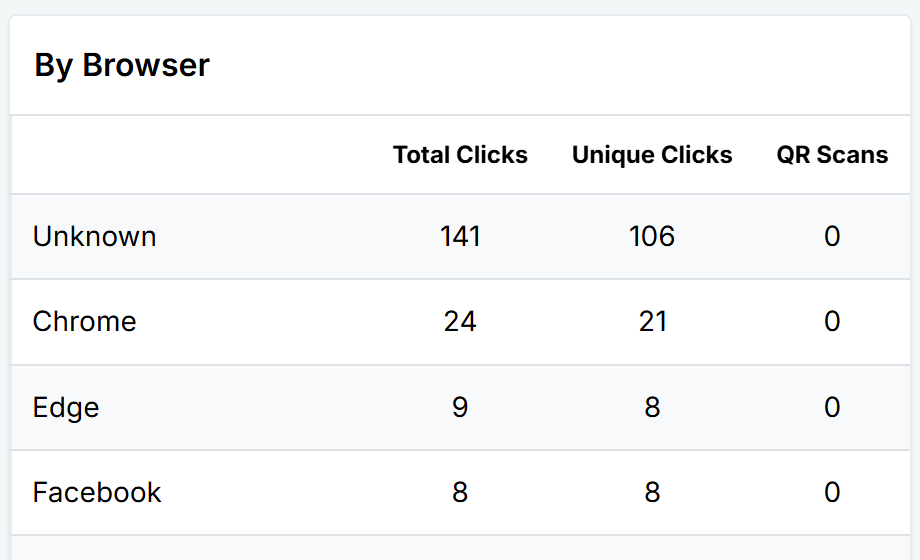
- By browser: Know which browsers your audience prefers (e.g., Chrome, Safari, Firefox)
Also read: What is geotargeting and why is it important for marketers?
Step 5: Apply campaign filters for deeper insights
To fine-tune your analysis, Replug lets you filter your data by:
- Time period: Choose from preset ranges or set a custom date range.
- Link type: The comparison graph will adjust based on the type of campaign selected:
• Short links: Clicks vs Unique Clicks vs QR Scans
• Bio links: Views vs Unique Views vs Clicks
• QR codes: QR Scans vs Total Clicks
Convert your followers into customers with single bio link.
Uplift your conversion rates by connecting all of your social accounts and business pages with a single bio link.
Get Started For Free!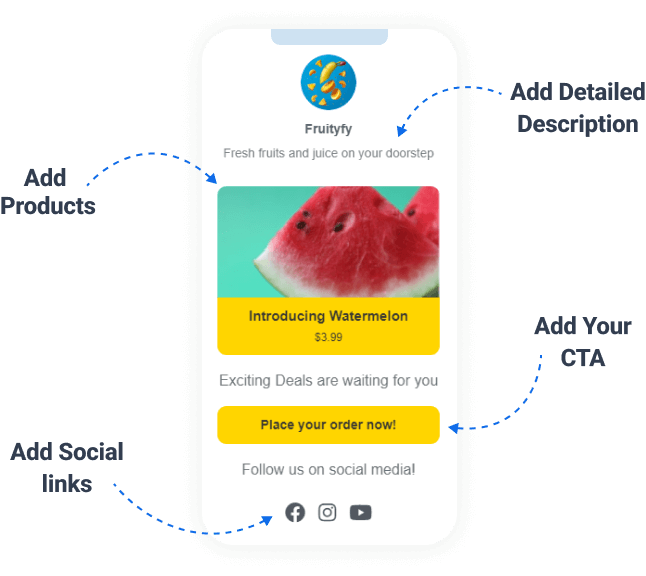
This helps you compare different formats and gain insights into how each type performs.
Benefits of analyzing campaigns with Replug
Here’s how campaign analytics with Replug can elevate your marketing efforts:
- Easy visual comparison: The real-time graph shows how your campaign is performing over time, helping you quickly spot spikes, dips, and trends.
- Optimize campaign performance: Identify your best-performing content, platforms, and formats, so you can focus on what brings the highest ROI.
- Tweak strategies in real time: See what’s working while your campaign is live and make adjustments on the go to improve results.
- Smarter marketing decisions: Insights by location, device, browser, and referral source help you shape future campaigns more strategically.
- Better reporting and client updates: Export clear, presentation-ready data to share progress with clients or internal teams.
- Improved retargeting and remarketing: Use behavior data to segment your audience and retarget them more effectively.
💡 Want to go a step further? Replug’s retargeting pixels let you re-engage people who click your links across ad platforms.
- Content and platform testing: Use data to A/B test formats and messaging across different channels and learn where your audience is most responsive.
- Cross-campaign insights: Compare short links vs. bio links vs. QR codes to see which formats bring the most traction.
Branded Short Links
Create and track branded short links for your business for better conversions.
Brand Your Links Now!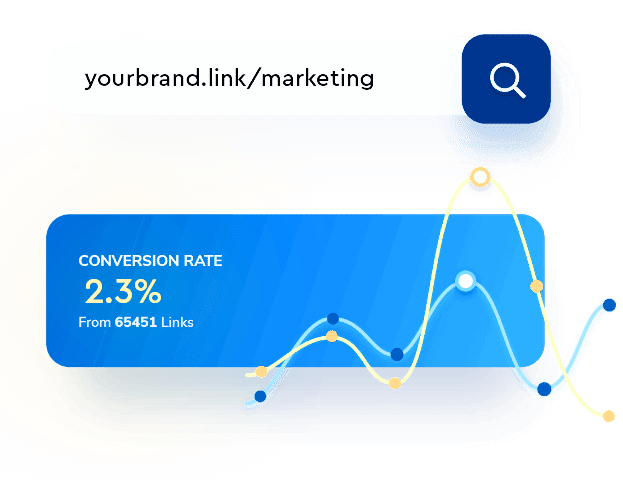
- Understand audience preferences: Get to know your users better, what they use, where they’re from, how they click, and tailor your marketing accordingly.
Conclusion
Replug gives you more than just link shortening; it gives you clarity. With its detailed analytics dashboard, campaign filtering, and real-time metrics, you can dig deep into performance, uncover valuable insights, and improve your marketing strategy with confidence.
Whether you’re running a single link campaign or managing dozens, Replug makes measuring success simple and actionable.
FAQs on how to measure campaign performance
Can I export performance reports from Replug?
Yes, Replug lets you export data for use in reports, presentations, or internal updates.
Does Replug show stats in real time?
Absolutely. Replug updates metrics live, so you always have the latest performance data.
Can I track QR code performance?
Yes. QR scans are tracked alongside link clicks and displayed in the campaign dashboard.
Will I still see stats for archived campaigns?
Yes. Just filter by “archived” campaigns and you’ll be able to view their full performance history.