


Mixpanel, Usermaven, Amplitude, Heap, Kissmetrics, and the list of product analytics tools go on…
Can’t decide where to stop your search? Well, this blog might end your search for the best product analytics tool. We’ve got you covered with comprehensive discussions on all aspects of analytics software.
To ensure we recommend the best fit for you, we evaluated the product analytics platforms mentioned below through a multi-step process.
First, we analyzed user reviews and satisfaction scores on G2, a trusted platform for software reviews.
We then conducted hands-on testing, exploring features and user interfaces to assess their suitability for different needs and technical skill sets.
Finally, we created a detailed feature comparison to identify which tool excelled in areas like automated tracking, funnel analysis, and data visualization
Key Takeaways:
- Factors to consider:
- User interface, budget, scalability, customizable dashboards, free trials, reviews, integrations, and privacy.
- Top choice: Usermaven
- Usermaven stands out with its advanced features, ease of use, affordable pricing, and strong data privacy compliance.
Best product analytics platforms – comparative analysis
- Usermaven vs Mixpanel:
- Usermaven offers AI insights, no-code event tracking, and better data privacy.
- Usermaven vs Amplitude:
- Usermaven provides real-time data, personalized support, and affordable pricing.
- Usermaven vs Heap:
- Usermaven is beginner-friendly and more affordable, especially for small businesses.
- Usermaven vs Kissmetrics:
- Usermaven excels in data retention, advanced features, and customer support.
- Usermaven vs Pendo:
- Usermaven offers a broader set of features and focuses on real-time data and AI insights.
- Usermaven vs Posthog:
- Usermaven is easier to use and excels in real-time data visualization.
- Usermaven vs Quantum Metrics:
- Usermaven offers detailed user journey mapping and other analytics.
- Usermaven vs Woopra:
- Usermaven provides AI-powered insights and lower costs, making it accessible for wider team participation.
8 benefits of using product analytic tools
The above part was just a drop in the bucket. Now we’ll talk ‘business’. We’ll show you some of the best benefits of using product analytics tools.
- By utilizing this product analytics tool, product owners and managers, UX designers, product engineers, and marketers can significantly reduce the time required for their tasks.
- Real-time data measurement allows for precise ROI calculations.
- Strengthens the connection with your customers, building a more solid relationship.
- See where users abandon your product and optimize your funnel to improve conversion rates and increase revenue.
- Use historical data to predict user behavior and identify potential churn risks.
- Gain actionable insights from live data – make data-driven decisions that boost your bottom line.
- Try out fresh features and assess feature adoption to pinpoint the most optimal features for your product.
- Maintain a high user retention rate by taking proactive steps to keep them engaged and happy.
9 best product analytics tools of 2024
| Tools | G2 Ratings | Limitations | Standout features |
| Usermaven | 4.9/5 | Limited features in free-trial | Advanced features set overall & provide 100% data control |
| Mixpanel | 4.6/5 | No data privacy | Custom event tracking & quick reports |
| Amplitude | 4.5/5 | Requires high-end technical expertise | In-depth behavioral insights & customizable dashboards |
| Heap | 4.4/5 | Limited historical data analysis | Complete user journey mapping & retroactive analysis |
| Kissmetrics | 4.1/5 | Complex integrations process | Focus on improving user retention & conversion (funnel reports & cohort analysis) |
| Posthog | 4.4/5 | No scalability for large teams | Self-hosted or cloud-hosted option & full data control |
| Pendo | 4.4/5 | Less comprehensive for broader product analytics needs | Focus on user onboarding, engagement & collecting user feedback (in-app surveys & walkthroughs) |
| Quantum metrics | 4.6/5 | Limited customization options | Rapid product iteration with AI focus (automatic error monitoring & journey analysis) |
| Woopra | 4.5/5 | Data export limitations | Real-time customer analytics & powerful funnels & journeys |
1. Usermaven – A powerful product analytics tool
Packed with a multitude of features, Usermaven is the ultimate product analytics platform that surpasses other tools. Get a fast and user-friendly interface, scalable pricing based on events, exceptional customer support, etc., and thank us later.
And if privacy is your top priority, then this platform is just perfect for you. It excels in this aspect by fully complying with GDPR & CCPA and ensuring the protection of user data.
What’s in it for you?
There’s a lot in it for you… Let’s start with the key features.
- Convenient dashboard
Gain instant clarity into key metrics with a user-friendly interface, allowing you to focus on what matters most. It pulls together all the key stats, like user acquisition by channel, DAU/MAU, feature usage, most engaged users, and much more.
- Automated event tracking
Automated event tracking makes life easier by automatically keeping track of what users are doing in your app. No need to manually set up tracking for every click or page view—it’s all handled for you.
- Funnel analysis
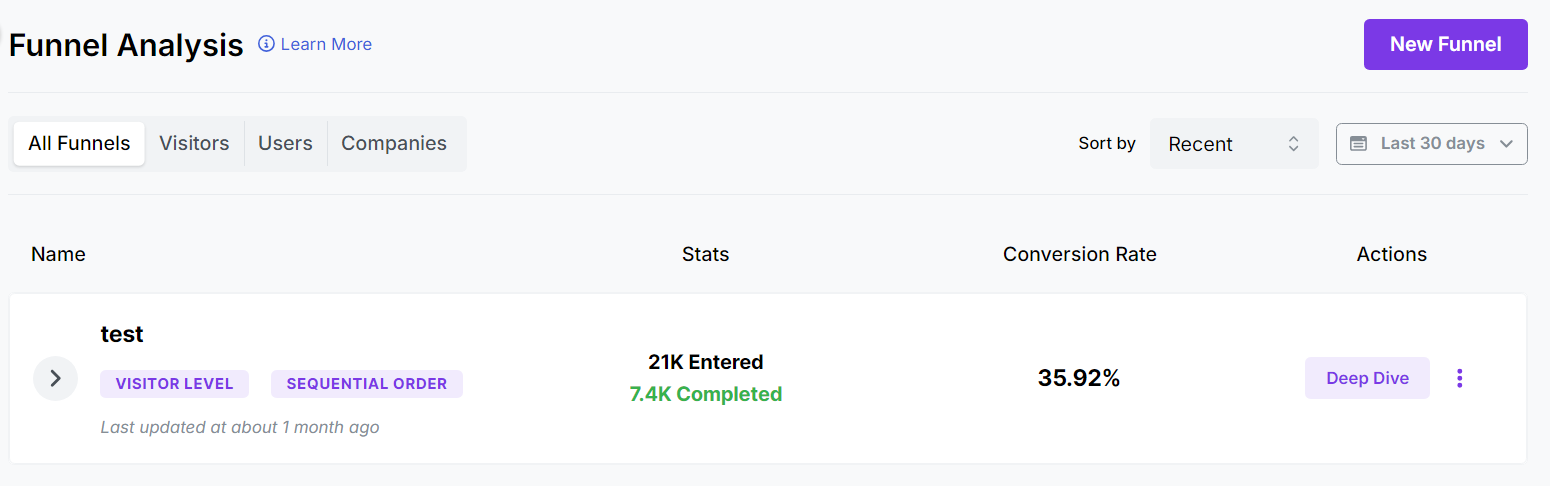
Usermaven’s funnel analysis breaks down the steps your users take to achieve a goal, like making a purchase or signing up. You can get a hold of conversion rate, average time spent, drop-off rate, etc.
- Granular attribution analysis
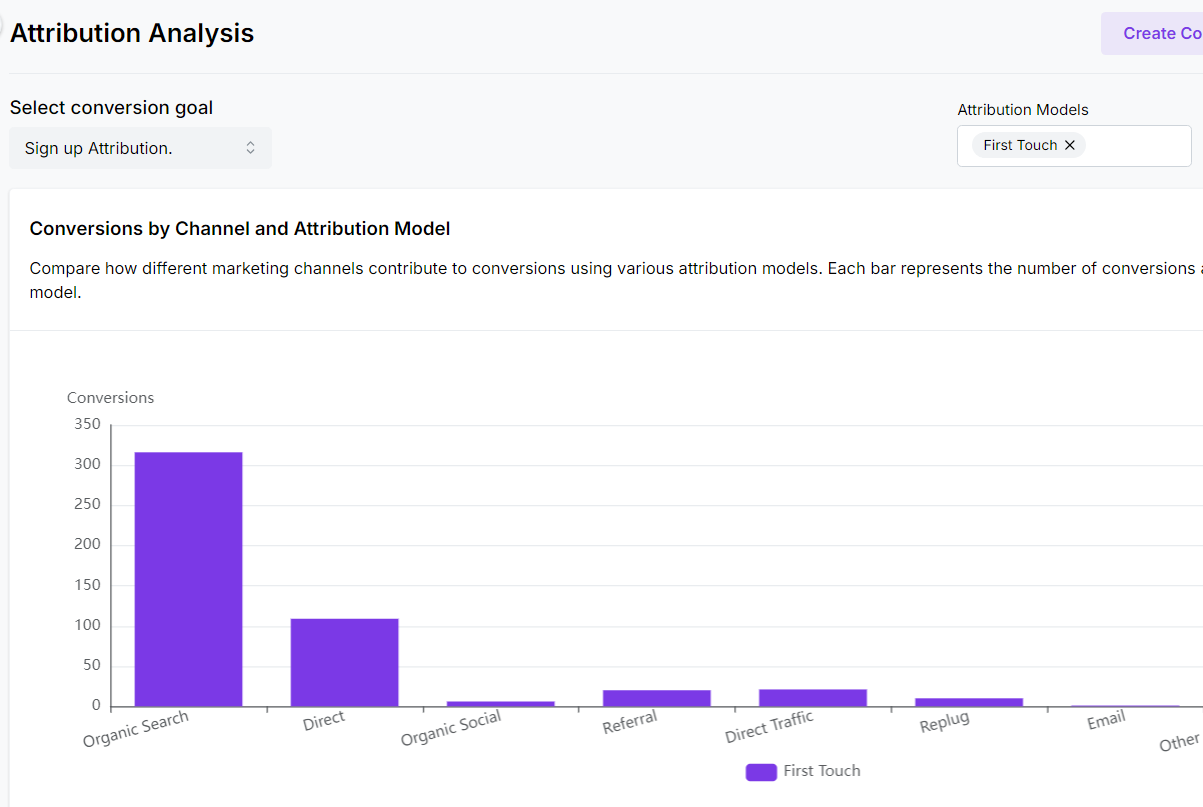
Multi-touch attribution helps you pinpoint which marketing channels are driving the most conversions. You can analyze data using the following attribution models.
| First touch | This credits the very first channel a user interacted with on their conversion journey. |
| Last touch | This assigns credit to the last channel a user interacted with before converting. |
| Linear | This acknowledges that users often interact with multiple channels before converting and assigns equal credit across those touchpoints. |
| U Shaped | This model gives 40% weightage to the first and last channel involved in conversions during the customer journey. |
| Time Decay | This model assigns more weight to touch points closer to the conversion and gradually reduces credit for earlier interactions. |
| First touch non-direct | This is just like the first touch attribution model, but it excludes the direct traffic channel if it occurs at the first touch. |
| Last touch non-direct | This is just like the last touch attribution model, but it excludes the direct traffic channel if it occurs at the last touch. |
You may also like: How to use UTM parameters for traffic attribution?
- Cohort analysis
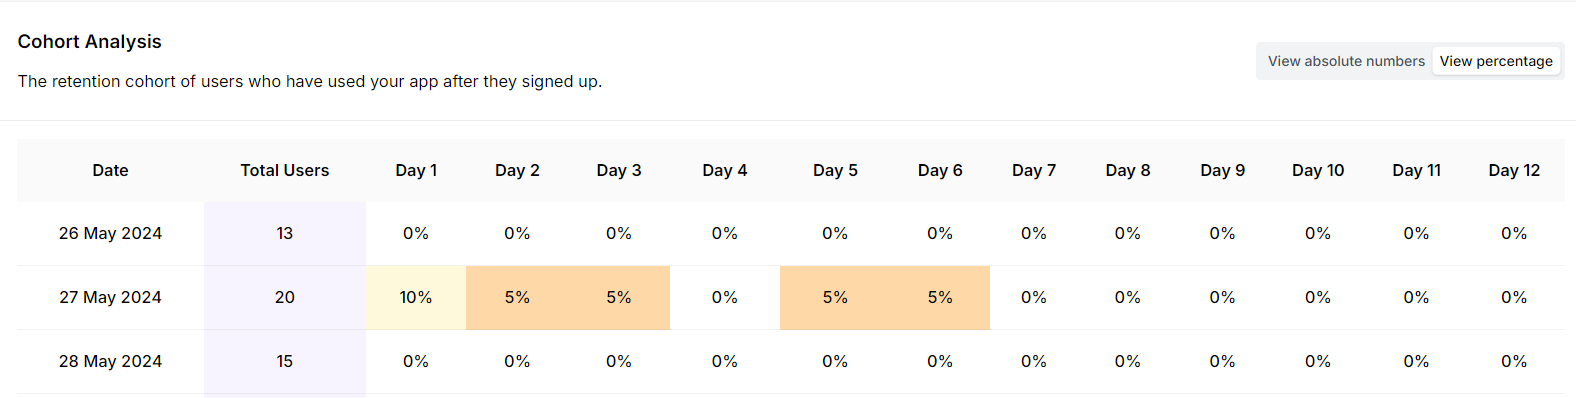
Compare the behavior of different user groups acquired at different times. This helps you understand user trends and measure the long-term impact of product changes.
- Feature adoption reports
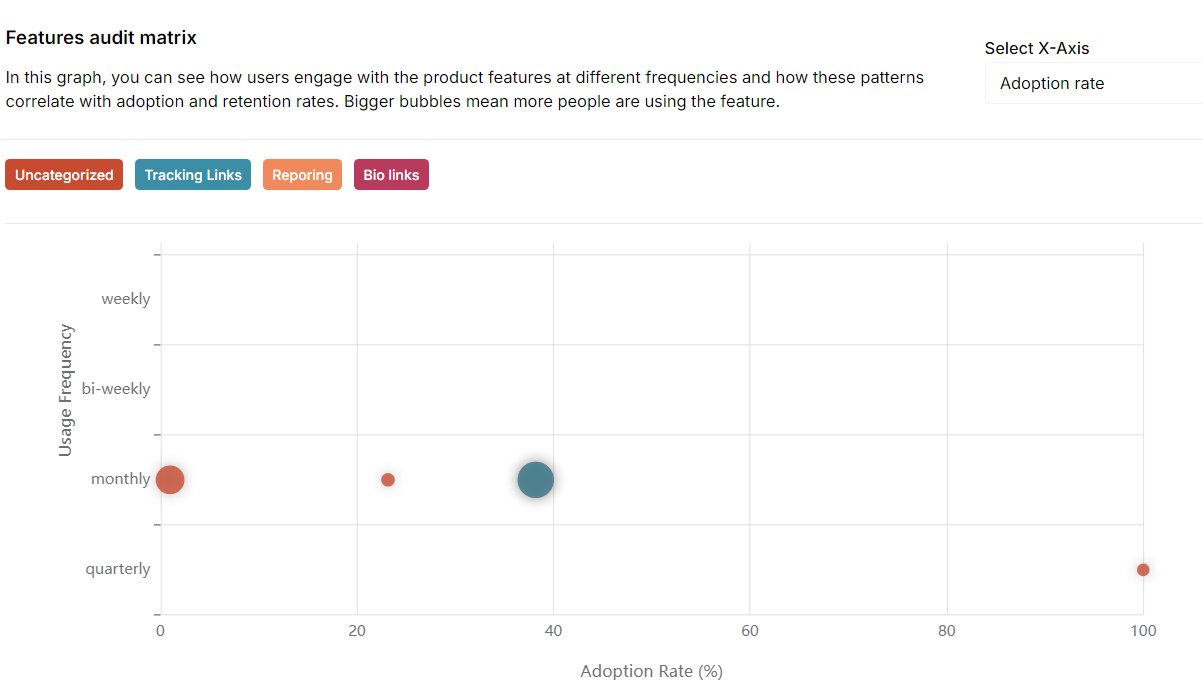
Feature adoption reports give you a clear picture of how new features are being used. They show you which features are hitting the mark and which ones need tweaking. With these insights, you can make informed decisions about future developments.
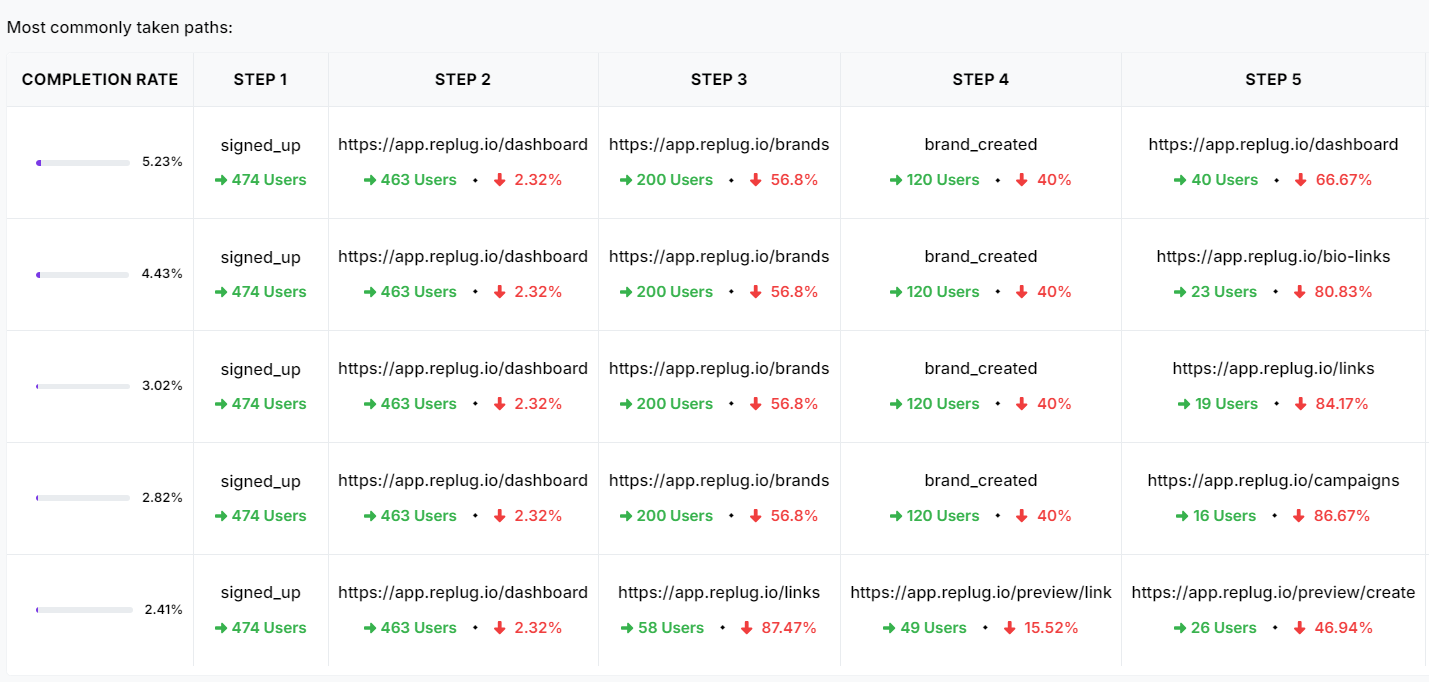
- Visualize the user journey.
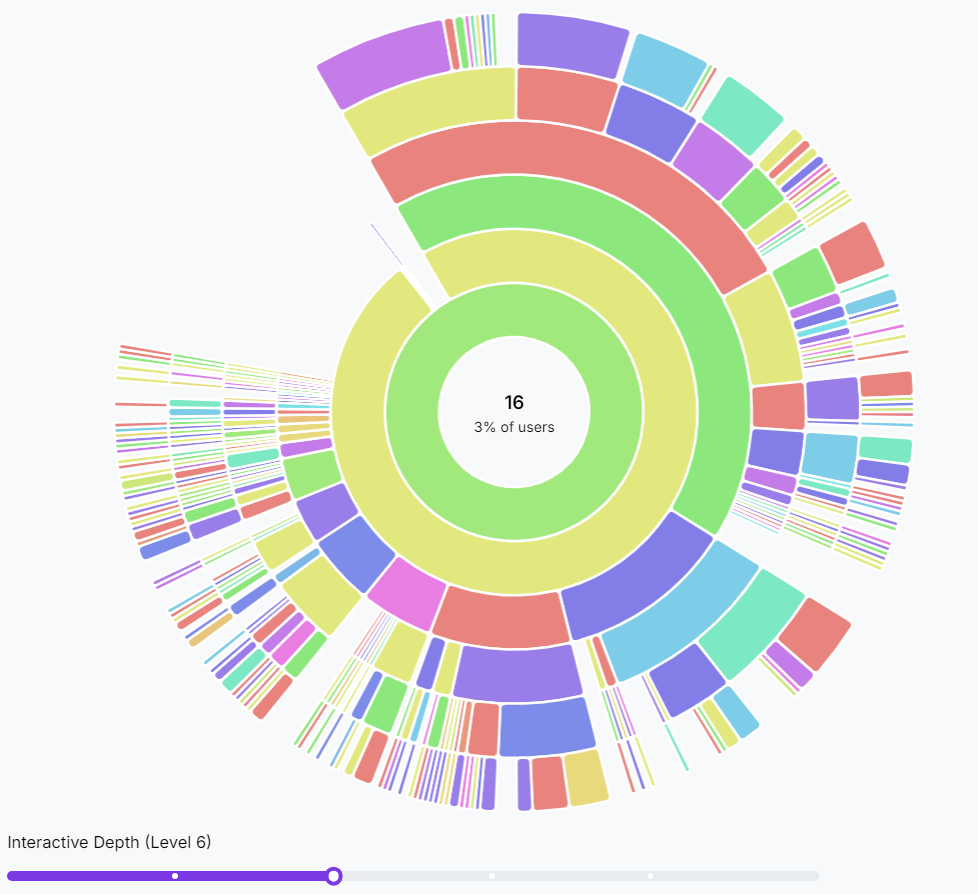
Visualizing the user journey is like mapping out the path users take through your product. It shows you the common routes they follow and highlights any spots where they might get confused or stuck.
You may also like: How to Create a Deep Link for a Seamless User Experience?
- Retention data
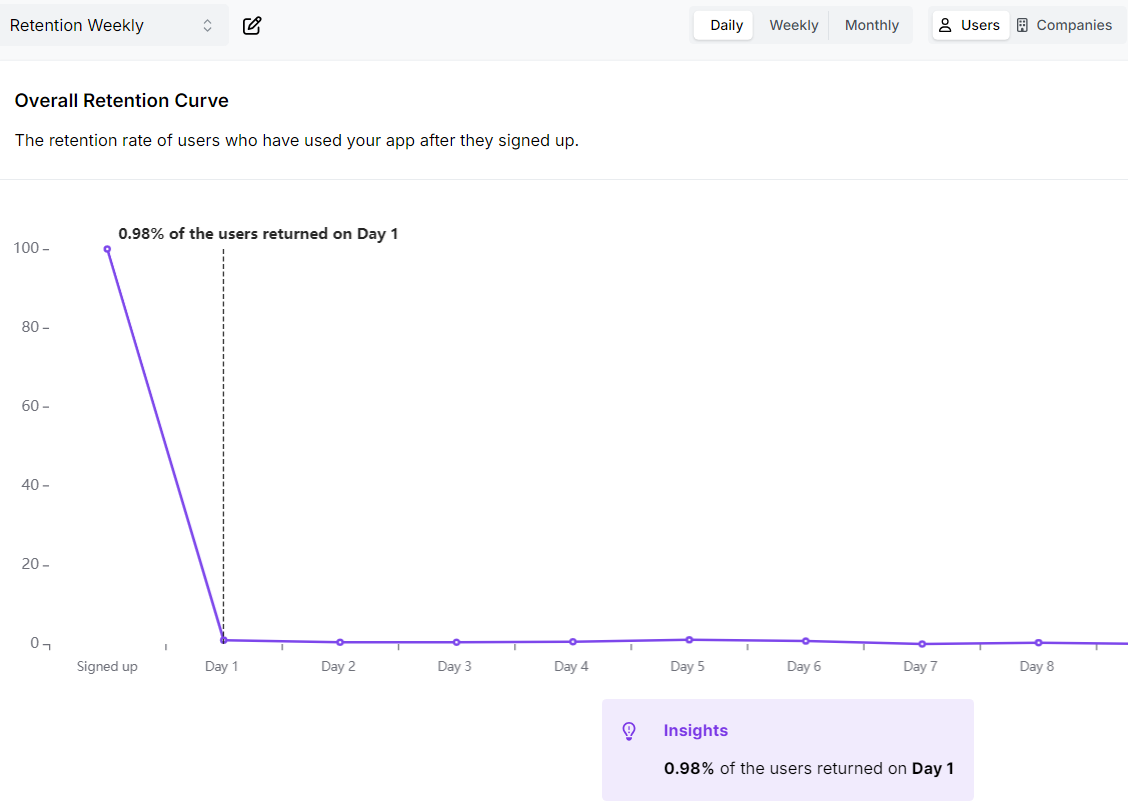
Retention data tracks how many users continue to use your product over time. It helps you understand the stickiness of your product and identify patterns in user behavior. By analyzing retention rates, you can determine what keeps users coming back and address issues causing churn.
- Engagement data
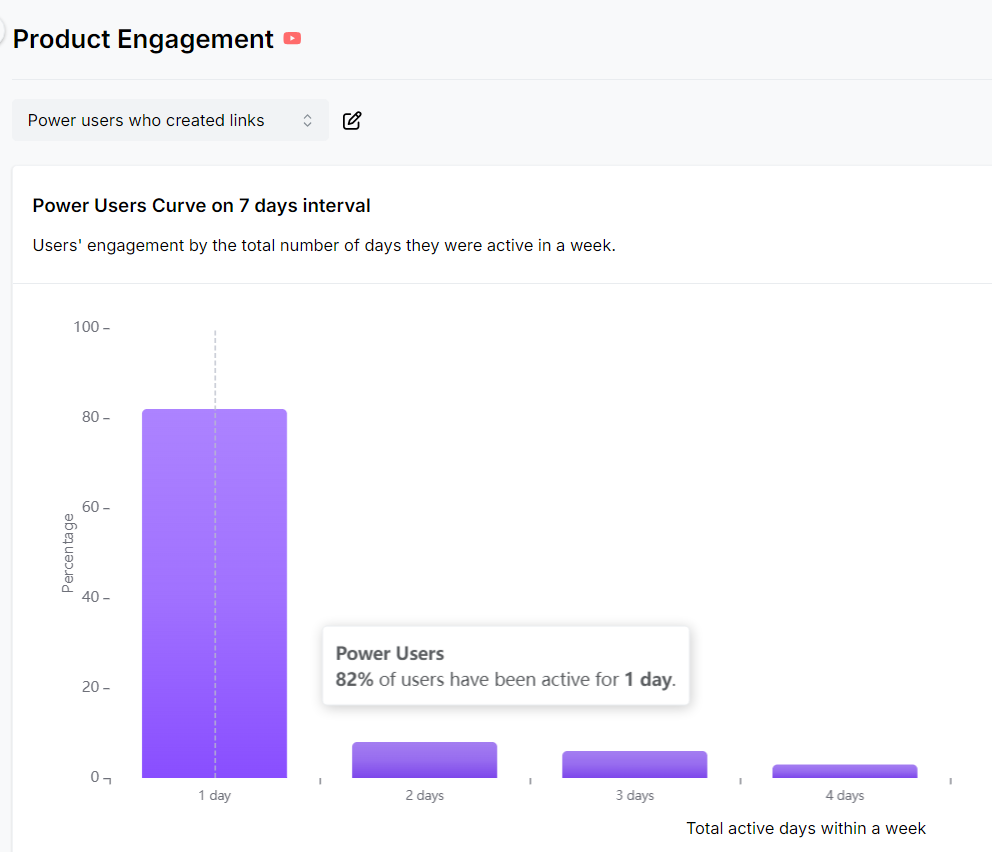
Engagement data measures how actively users interact with your product. It includes metrics like session frequency, duration, and feature usage. This information helps you gauge user interest and identify which aspects of your product are most engaging.
You may also like: How to Measure Social Media Engagement: 12 Crucial Metrics
- Smart AI insights
Go beyond basic data with Usermaven’s Maven AI tool, an intelligent data assistant. It provides actionable recommendations to optimize your SaaS analytics. Simply ask questions using natural language, and Maven AI delivers precise answers.
| What else? Forget fumbling with multiple tools – Usermaven is your one-stop shop for understanding how users interact with your product and website. See which marketing campaigns bring in the most visitors by tracking UTM parameters. Or set and conversion track goals for key actions like sign-ups, purchases, and downloads, so you know what’s working. Besides that, enjoy features like content tracking, bounce rate, first-party pixel connection, total sessions, total events, heatmaps, audience demographics, referral sources, and mobile vs. Desktop analytics. |
Let’s go through the pricing of Usermaven:
| Pro plan | Starts at $14 /month (100K events) – Can be upgraded as per the number of events |
| Premium plan | Starts at 24 /month (100K events) – Can be upgraded as per the number of events |
| Enterprise plan | Custom – Contact the sales team |
Here’s what users say about Usermaven
| “This is one of the best tracking tools out there”David K.CEO |
| “Usermaven is 100 times easier than GA4!”Ferdinand M.Founder |
| “Uncomplicated Analytics Magic for Real-Time Insights!”Lori V. |
2. Mixpanel
Best for: Teams who prefer features like custom dashboards, custom event tracking, and quick reports.
Why choose this product analytics tool?
Mixpanel helps app creators understand the why of analytics! By tracking how users tap, swipe, and click, Mixpanel exposes what works and what flops and creates a product that your users will love.
- Custom event tracking: This allows you to set up custom events within your app to monitor specific user actions.
- User group targeting: Group users based on their behavior and tailor your app experience to keep them happy.
- Fast onboarding insights: See how well users navigate that initial app setup. Identify any onboarding roadblocks and smooth the way for new users.
- Feature adoption reports: Track how users engage with new features. This helps you see what’s working, what flops, and where to improve.
Remember that Mixpanel may not offer full control over your data privacy and lacks auto-capture event tracking. Moreover, its custom pricing structure, particularly for larger companies, could lead you to explore Mixpanel alternatives.
User reviews of Mixpanel
Users think that it’s great for startups:
“Great for startup product analytics”
Users think that the tool has data privacy issues.
“ The only downside is that there are data privacy concerns”
Mixpanel vs Usermaven summary
| Features | Mixpanel | Usermaven |
| Product analytics | Yes | Yes |
| Funnel analysis | Yes | Yes |
| AI funnel insights | No | Yes |
| 100% data control | No | Yes |
| Advance feature analysis | Yes | Yes |
| Onboarding reports | Yes | Yes |
| Data retention | Up to 6 months | 2 years to forever |
| No-code event tracking | No | Yes |
| Cohort analysis | Yes | Yes |
| Power users report | No | Yes |
| User-friendly interface | Yes | Yes |
| Live chat support | Add-on ( with extra fee) | Yes |
| Pricing transparency | Yes | Yes |
Mixpanel vs Usermaven: Pricing comparison
| Mixpanel | Usermaven |
| Free plan at $0 with extremely basic features | You get a 30-day free trial |
| Growth plan starts at $28/ month | Premium plan starts at $24 /month |
| Offers custom enterprise plan | Offers custom enterprise plan |

3. Amplitude
Best for: Large teams and enterprises needing in-depth behavioral insights.

Why choose this product analytics tool?
Amplitude, an event-based analytics platform founded in 2012, stands out as a premier choice for businesses looking to deeply understand user behavior and optimize their digital products.
- Customizable dashboards and reports: With Amplitude, users can create customized dashboards and reports that suit their specific needs. The intuitive interface allows for easy visualization of key metrics, making it simple to track performance and share insights with stakeholders.
- Wide integration capabilities: The platform integrates seamlessly with a variety of other tools and platforms, such as Slack, Salesforce, and Google Analytics.
- Pathfinder reports: Pathfinder reports provide detailed insights into user behavior, helping businesses uncover hidden patterns and opportunities for improvement.
- Retention analysis: By analyzing retention data, product managers can identify which actions or behaviors lead to long-term engagement and customer loyalty.
User reviews of Amplitude
“Great tool for understanding user’s experiences”
Amelia S. (Product Analyst)
“I like amplitude because it helps to make the dashboard easy and fast”
Eduard V. (Product Manager)
Usermaven vs Amplitude summary
| Features | Amplitude | Usermaven |
| Product analytics | Yes | Yes |
| User journeys | Yes | Yes |
| Auto-capture events | Through plugin | Yes |
| On-boarding reports | Yes | Yes |
| Share dashboards externally | Yes | Yes |
| Custom events | Yes | Yes |
| Slipping away user reports | No | Yes |
| Unsampled data | No | Yes |
| 100% data control | No | Yes |
| Value for money | No | Yes |
| Live chat support | Limited | Yes |
Usermaven vs Amplitude: Pricing comparison
| Amplitude | Usermaven |
| Plus from $61/mo | You get a 30-day free trial |
| Growth plan most likely to start around $995/month | Premium plan starts at $24 /month |
| Enterprise plan likely to start at $2,000+/month | For enterprise plans contact the sales team |
4. Heap
Best for: Teams looking for a detailed user journey mapping.

Why choose this product analytics tool?
Heap, a cloud-based data analytics platform known for its high-end feature set and customization capabilities. It provides real-time analytics by tracking every user interaction on the web or app, highlighting the user’s digital journey which businesses can use to improve customer retention. Here are some important points:
- Complete user behavior visibility: Unlike traditional analytics tools that require predefined event tracking, Heap provides retroactive analysis. This means you can explore and analyze user behavior even if you didn’t set up tracking beforehand.
- Segmentation and personalization: It enables segmentation based on user attributes and behaviors, empowering you to personalize user experiences and target specific user groups.
- Collaboration and sharing: Heap facilitates collaboration by allowing team members to easily share insights and reports, fostering a data-driven culture across your organization.
Despite its strengths, Heap has some notable drawbacks. It has a steep learning curve, limited segmentation capabilities, poor customer support, high pricing, and complex integration processes. These issues may lead businesses to consider alternative analytics tools.
User reviews of Heap
“Heap is a great analytics tool”
Tyler J. (Small-Business-Owner)
“Great self-service user metrics tool”
Verified User in Real Estate Mid-Market
Usermaven vs Heap summary
| Features | Heap | Usermaven |
| Product analytics | Yes | Yes |
| 100% data control | No | Yes |
| Feature adoption | Yes | Yes |
| Funnel analytics | Yes | Yes |
| Cookie less tracking | No | Yes |
| Product engagement report | Yes | Yes |
| Data retention | 12 months or more available as an add-on | 2 years to forever |
| Custom channel mapping | N/A | Yes |
| Easy user interface | No | Yes |
| Retention report | Yes | Yes |
| Complete data control | No | Yes |
| Dashboard sharing | Yes | Yes |
| Dedicated support specialist | Yes | Yes |
Usermaven vs Heap: Pricing comparison
| Heap | Usermaven |
| Contact sales for exact pricing | You get a 30-day free trial |
| Premium plan starts at $24 /month | |
| For enterprise plans contact the sales team |
5. Kissmetrics
Best for: Businesses focused on improving user retention and conversion.

Why choose this product analytics tool?
Kissmetrics, another well-known name in the product tool industry, was initially developed by Neil Patel and Hiten Shah, particularly for e-commerce businesses. Kissmetrics offers a range of features including:
- Funnel reports: With Kissmetrics, you can create and analyze conversion funnels to track user journeys through various stages of your sales or conversion process.
- Cohort analysis: It offers powerful cohort analysis capabilities, allowing you to group users based on shared characteristics or behaviors and track how these cohorts perform over time.
- Customer lifetime value (LTV) analysis: Kissmetrics helps businesses calculate and analyze the lifetime value of their customers.
- Wide integration capabilities: It offers integrations with a wide range of third-party tools and platforms, including CRM systems, email marketing software, and customer support platforms.
While Kissmetrics provides many useful features, it comes at a higher price point than some of its competitors. This can be a barrier for small businesses or startups with limited budgets.
User reviews of Kissmetrics
“A metrics and analytics solution to drive growth for any organization”
Brian E. (Senior Human Resources Generalist)
“Helped us to increase our conversions”
Nicholas D. (Marketing Professional)
Usermaven vs Kissmetrics summary
| Features | Kissmetrics | Usermaven |
| Product analytics | Yes | Yes |
| Automated event tracking | No | Yes |
| Segmentation | Yes | Yes |
| Funnel reports | Yes | Yes |
| Simplified UI | No | Yes |
| Analytics dashboard | Yes | Yes |
| Custom reports | Yes | Coming soon |
| AI funnel insights | No | Yes |
| Cohort reports | Yes | Yes |
| Affordable pricing | No | Yes |
| Detailed documentation | No | Yes |
| Data retention | 36 Months | 2 years to forever |
| Good customer support | Yes | Yes |
Usermaven vs Kissmetrics: Pricing comparison
| Kissmetrics | Usermaven |
| Pay as you go plan starts at $25 per month | You get a 30-day free trial |
| Silver plan starts at $199/mo | Premium plan starts at $24 /month |
| Gold plan starts at $499/mo | For enterprise plans contact the sales team |
| Custom plan |
6. Posthog
Best for: Teams needing full data control and customization.

Why choose this product analytics tool?
The next on our list is Posthog, an analytics tool that gives a strong challenge to Usermaven as both tools offer a comprehensive suite of features. Posthog is ideal for teams who need in-depth user insights and the ability to run experiments for optimization. Besides that, it also allows integrations with popular marketing and analytics platforms.
- Self-hosted or cloud-hosted options: PostHog gives you the flexibility to deploy it either on your infrastructure (self-hosted) or use their cloud-hosted service, depending on your preferences and requirements.
- Feature flags and A/B testing: It includes feature flags and A/B testing capabilities, allowing you to safely roll out new features and experiment with different variations to optimize user experience and conversions.
- API and integrations: It provides API and supports integrations with various third-party tools and platforms, allowing you to centralize your data and extend PostHog’s functionality as needed.
User reviews of PostHog
“As a young startup founder, Potshog Analytics has helped me improve my product a ton!”
Tristan M. (CEO, Founder)
“So much better than Google Analytics”
Donald L. (FunnelHacker)
Posthog vs Usermaven: Summary
| Features | PostHog | Usermaven |
| Product analytics | Yes | Yes |
| Dashboard | Yes | Yes |
| Funnel reports | Yes | Yes |
| Track custom events | Yes | Yes |
| User paths | Yes | Yes |
| Data retention | 1 – 7 years | 2 years to forever |
| Advance segmentation | No | Yes |
| Customization capabilities | No | Yes |
| Drag-and-drop functionalities | No | Yes |
| High-end customer support | No | Yes |
| Real-time reporting | No | Yes |
| Predictive insights | No | Yes |
| Best for non-technical users | No | Yes |
Posthog vs Usermaven: Pricing comparison
| Posthog | Usermaven |
| Does offer a free trial | You get a 30-day free trial |
| Custom pricing only | Premium plan starts at $24 /month |
| Custom pricing only | For enterprise plans contact the sales team |
Branded Short Links
Create and track branded short links for your business for better conversions.
Brand Your Links Now!
7. Pendo
Best for: Teams focused on user onboarding, engagement, and collecting user feedback.

Why choose this product analytics tool?
Pendo offers a well-rounded product analytics suite with a strong focus on user onboarding, engagement, and feature adoption. In easier words, it excels at guiding users through product features with walkthroughs and tooltips and provides insights into feature usage.
- In-app surveys: Gather real-time feedback directly from users through customizable in-app surveys. Trigger surveys based on user behavior to collect targeted, relevant feedback.
- In-app guidance and messaging: Create step-by-step walkthroughs, tooltips, and banners to help users navigate your product. Enhance user experience and reduce support requests with proactive guidance.
- Feature adoption reports: Understand how users interact with your product’s features through detailed adoption reports. Identify popular features and areas needing improvement or additional guidance.
User reviews of Pendo
“Sadly not very customer-centric, multiple product glued together and missing a lot of features”
Pierre. (Head of Product)
“Scalable product insights and user guidence”
Robert R. (Vice President Product)
Pendo vs Usermaven: Summary
| Features | Pendo | Usermaven |
| Product analytics | Yes | Yes |
| Feature adoption | Yes | Yes |
| Auto event tracking | Yes | Yes |
| Filter by cohort | Yes | Yes |
| Quick and easy to use | No | Yes |
| Heatmaps | Yes | Yes |
| User stickiness metrics | Yes | Yes |
| Advance reporting capabilities | No | Yes |
| Custom events | Yes | Yes |
| No dependency on engineering resources | No | Yes |
| Feature overlapping | Yes | No |
| Funnel analysis | Yes | Yes |
| Data retention | 7 years | 2 years to forever |
| Extensive integration | No | Yes |
| Value for money | No | Yes |
Pendo vs Usermaven: Pricing comparison
| Pendo | Usermaven |
| Custom pricing only | You get a 30-day free trial |
| Premium plan starts at $24 /month | |
| For enterprise plans contact the sales team |
You may also like: Replug click analytics: The prime solution for turning clicks into conversions
8. Quantum Metrics
Best for: Teams focused on rapid product iteration and improvement.

Why choose this product analytics tool?
Quantum Metrics is a user analytics platform geared towards businesses with a large user base and development teams. It utilizes artificial intelligence to analyze vast amounts of user data, automatically pinpointing areas where users encounter friction or frustration. This focus on automation allows for quick identification of conversion roadblocks and usability issues.
Some of its prominent features include:
- Revenue attribution: Understand how different user groups and behaviors contribute to revenue.
- Error monitoring: Automatically detect and monitor errors that users encounter on your site or app. Quickly address and resolve issues to improve user experience and reduce frustration.
- Journey analysis: Visualize and analyze user journeys to understand the paths users take through your site or app.
- Session replay: Watch recordings of user sessions to see exactly how users interact with your site or app. This helps in understanding user behavior and identifying pain points.
User reviews of Quantum Metrics
“Gives great insights, but set up is cumbersome”
Vikas M. (Product Manager)
“Opportunities for improvement but overall a great experience”
Verified User in Insurance
Quantum Metrics vs Usermaven: Summary
| Features | Quantum Metric | Usermaven |
| Product analytics dashboard | Yes | Yes |
| In-depth user journey | Basic | Yes |
| AI insights | Yes | Yes |
| Detailed documentation | No | Yes |
| Behavioral metrics | Yes | Yes |
| Segmentation | Yes | Yes |
| Customer churn | Yes | Yes |
| Heatmaps | Yes | Yes |
| Easy for non-technical users | No | Yes |
| Advanced reporting capabilities | No | Yes |
| Affordable pricing plans | No | Yes |
Quantum Metrics vs Usermaven: Pricing comparison
| Quantum metrics | Usermaven |
| Custom pricing only | You get a 30-day free trial |
| Premium plan starts at $24 /month | |
| For enterprise plans contact the sales team |
Link Management Made Easy
Your go to link management tool for CTAs, branded and bio links, QR Codes, tracking and retargeting.
Get Started for FREE!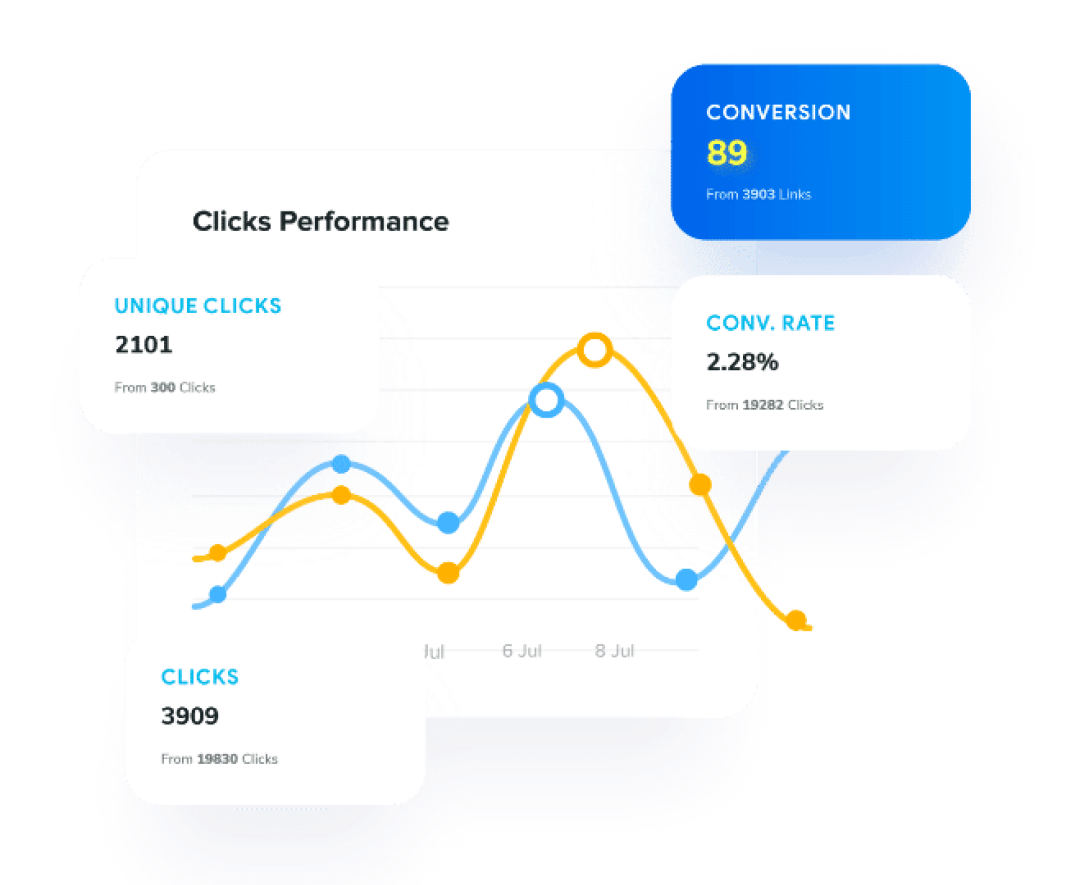
9. Woopra
Best for: Organizations seeking to analyze user behavior across all digital channels to optimize customer experiences and drive growth.
Why choose this product analytics tool?
Lastly, we have Woopra renowned for its real-time customer analytics, enabling businesses to track and analyze user behavior as it happens.
- Real-time reporting: Get insights into user behavior as it happens. This allows you to identify and address any issues immediately, optimizing your product for maximum impact.
- Powerful funnels & journeys: Identify drop-off points within your sales or onboarding funnels. Woopra’s journey mapping helps you visualize the complete customer path and identify areas for improvement.
However, Usermaven provides so much more alongside AI-powered insights, and potentially lower cost (depending on usage) could be advantageous for businesses seeking a comprehensive analytics platform that doesn’t require constant monitoring.
Woopra vs Usermaven: Summary
| Features | Woopra | Usermaven |
| Product analytics dashboard | Yes | Yes |
| Custom event tracking | Yes | Yes |
| Funnel reporting | Yes | Yes |
| Cookieless tracking | No | Yes |
| Heatmaps | No | Yes |
| Attribution reports | Yes | Yes |
| User journey tracking | Yes | Yes |
| Customization capabilities | No | Yes |
| Cohort analysis | Yes | Yes |
| Real-time reporting | Yes | Yes |
| Easy to use | No | Yes |
| Data retention | 2 years to forever | 24+ Months |
| Affordable pricing plans | No | Yes |
User reviews of Woopra
“Very useful insight”
Verified User in Professional Training & Coaching
“Very strong CDP platform that could help our company have more critical market insight”
Verified User in Media Production
Woopra vs Usermaven: Pricing comparison
| Woopra | Usermaven |
| The core plan is free | You get a 30-day free trial |
| Pro plan $ 999/ month | Premium plan starts at $24 /month |
| For enterprise plans contact the sales team | For enterprise plans contact the sales team |
Also read: 20 SaaS product metrics to track for success
What is the best product analytics platform?
You might have heard that there isn’t one “best” product analytics platform since the perfect choice varies depending on your requirements and priorities.
However, we don’t think the same. Through extensive research and testing of analytics tools, we have concluded that Usermaven (a digital analytics tool offering website and product data) is undoubtedly a top choice among other analytics software.
Must-have factors to look out for in product analytics tools
With a wide range of product analytics tools available, choosing the right one can be overwhelming. A well-structured product management checklist can help simplify this decision by outlining essential features and requirements. Here are some of the most important things to keep in mind.
| Key factors to consider | Description |
| User interface | Opt for an intuitive interface that makes it easy to explore and understand your data. A user-friendly design streamlines decision-making and analysis. |
| Budget and scalability | Consider your budget and growth plans. Choose a tool with transparent pricing and scalable features that can grow with your business needs. |
| Customizable dashboards | Find a tool that lets you create dashboards tailored to your specific metrics and reporting needs. This way, you can focus on what matters most to your business. |
| Free trails or demos | Take advantage of free trial periods to test the tool’s functionalities firsthand. Free trials allow you to assess compatibility with your business needs and evaluate ease of use before making a commitment. |
| Reviews and ratings | Research user reviews and expert ratings to gauge the tool’s performance, reliability, and customer support. Insights from other users provide valuable perspectives on real-world usability and satisfaction. |
| Integrations | Make sure the tool integrates smoothly with other platforms you use, such as CRM or marketing automation software. |
| Privacy focused | Prioritize tools that uphold robust data privacy and security measures. Look for compliance with industry standards (e.g., GDPR, CCPA) to safeguard sensitive information and build trust with users. |
Conclusion
So grab a coffee, ditch the stress, and let’s find your analytics bestie!
As this comprehensive guide cuts through the confusion to reveal the ultimate solution for your needs. We’ve meticulously analyzed and compared top contenders, and guess what? There’s a clear winner!
Usermaven stands out for its comprehensive features, ease of use, and affordability. Its advanced analytics, AI-powered insights, and strong data privacy compliance make it an excellent choice for businesses of all sizes.
Whether you’re a startup or a large enterprise, investing in a tool like Usermaven can greatly enhance your ability to make informed decisions.
Here are a few more that didn’t make the top list but are worth your consideration as an analytics tool.
- GA4
- Hotjar
- FullStory
- Indicative
- Userpilot
- LogRocket
- Simple analytics
- Baremetrics
FAQs related to product analytics
What are product analytics tools & how do they work?
Product analytics tools are used to collect, analyze, and visually represent data associated with a product. In simple words, product teams and marketers can see how users interact with their digital products.
Your product analytics tool should answer these questions.
- What are the most common user flows within the product?
- Which features are users engaging with the most?
- Are there any features with low usage that could be improved or removed?
- At what points do users most commonly disengage or abandon their tasks within the product?
And much more because the possibilities for analysis are endless.
What are product metrics?
Product metrics are quantifiable data points that measure various aspects of a product’s performance, usage, and user behavior.
Who uses product analytics tools?
Product managers, UX designers, marketers, and data analysts commonly use product analytics tools. These tools help them make informed decisions based on user behavior and product performance data.
How user-friendly are product analytics tools for non-technical users?
Many product analytics tools offer intuitive interfaces and no-code features, making them accessible to non-technical users. User-friendly designs and AI assistants further simplify data analysis for broader team participation.
How do these tools handle data privacy and GDPR compliance?
Product analytics tools typically include features to ensure data privacy and GDPR compliance, such as data anonymization, user consent management, and secure data storage. They often provide documentation and support to help businesses maintain compliance.
Can these tools track user engagement across different devices?
Yes, many SaaS analytics platforms, can track user engagement across multiple devices. They provide a unified view of user interactions to help businesses understand cross-device behavior.
When to invest in a product analytics tool?
Invest in a product analytics tool when you need detailed insights into user behavior, want to optimize product performance, and aim to drive data-driven decision-making across your team. It’s especially valuable during product growth or transformation phases.